Control what you see/ Never miss a chance
ChartsWatcher is a professional application for traders to filter and view all changes to the stock, crypto and forex market. The new standard for market scanners.
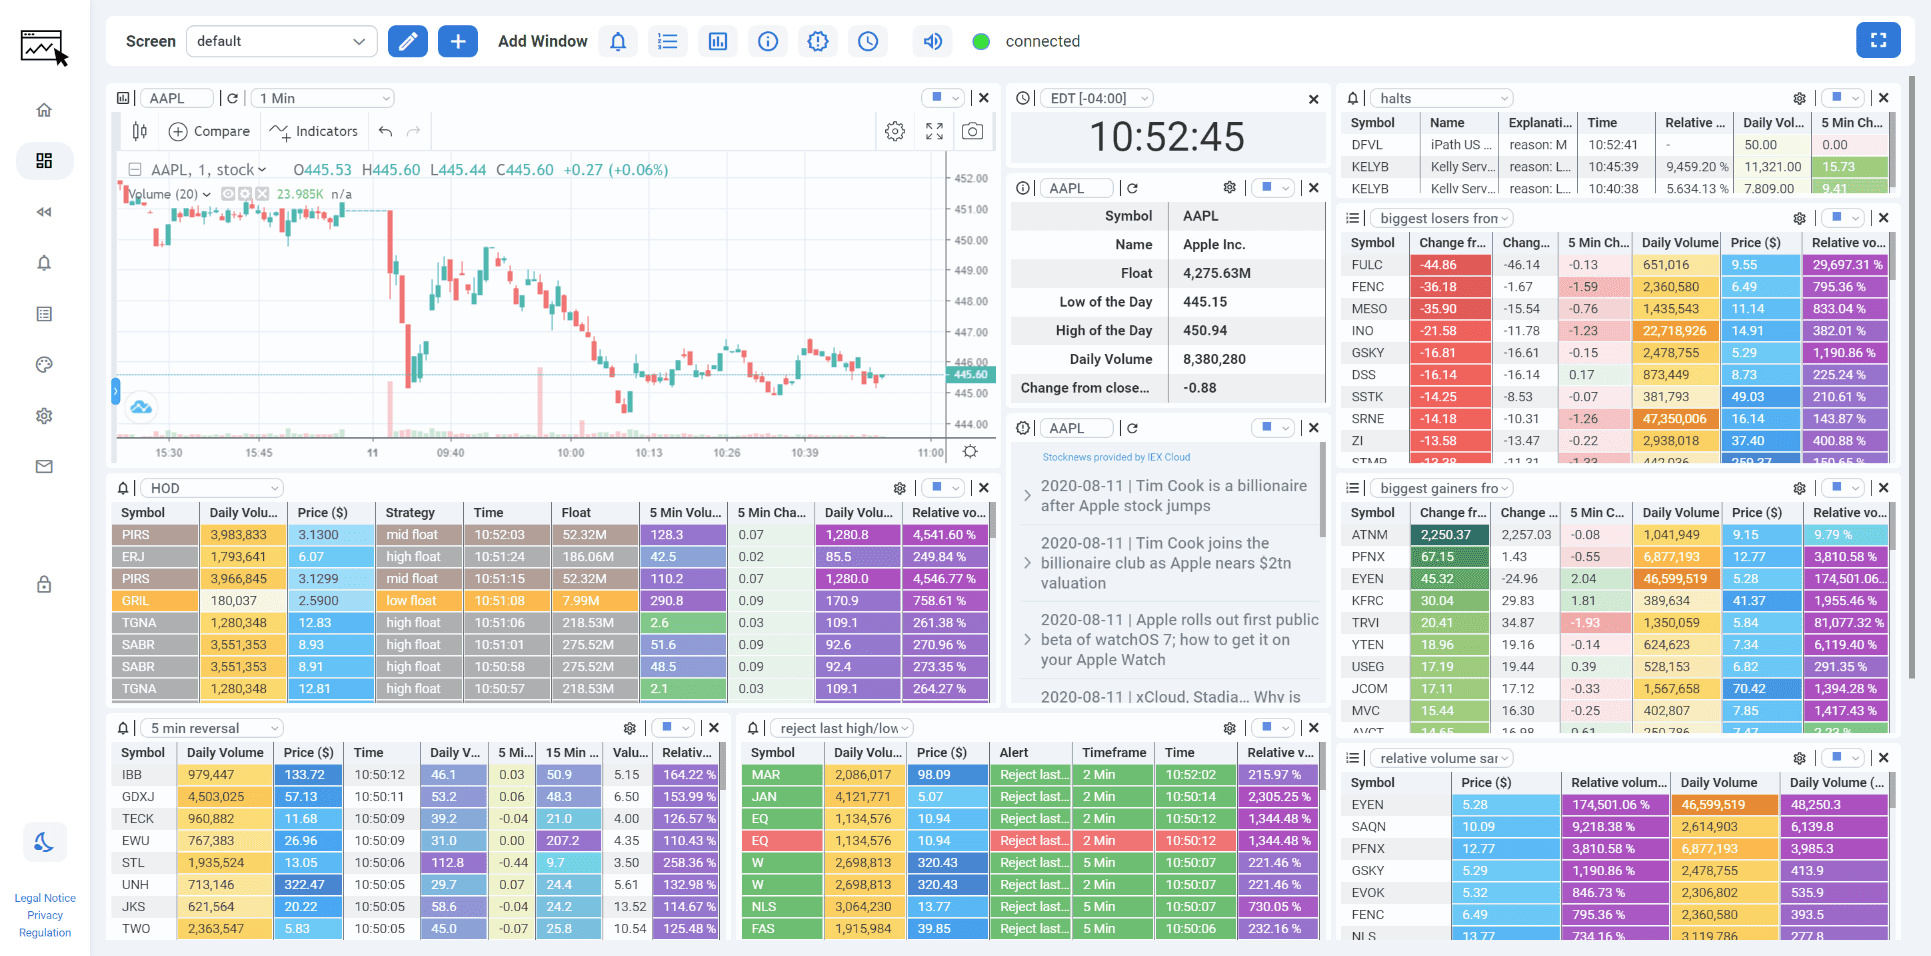
8 different kind of windows
ChartsWatcher allows you to freely arrange different tiles with different settings on your screen. You can create multiple screen configurations. Most tiles allow you to select a channel that can be used to synchronize them to a stock or currency.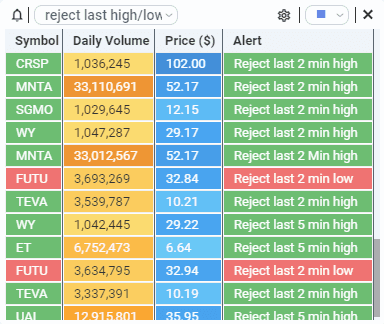
Alert
In the alert tile, you can view the alerts about one or more of your defined strategies. Along with strategies, you can define which columns you want to see. For each column with a value, you can also define a custom color scheme.
Toplist
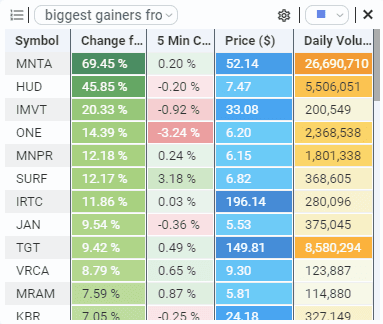
In the toplist tile you can view a current toplist for a defined filter, for example, price. To customize your selected toplist even more, it is possible to add other filters. Just as with the alert tile, you can define which columns you want to see. For each column with a value, you can also define a custom color scheme.
Chart
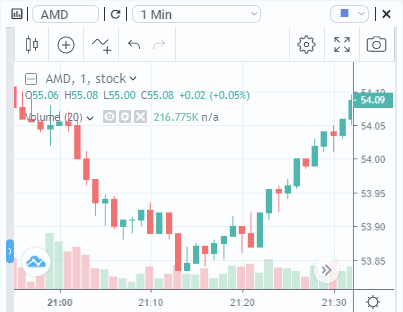
The chart tile is a perfect tool to visualize live market changes. You can view different timeframes from one minute up to one day. The chart is interactive and you can zoom in and out and scroll through the timeline. When you click on a specific alert indicator, that alert will be shown in the chart.
Newsfeed
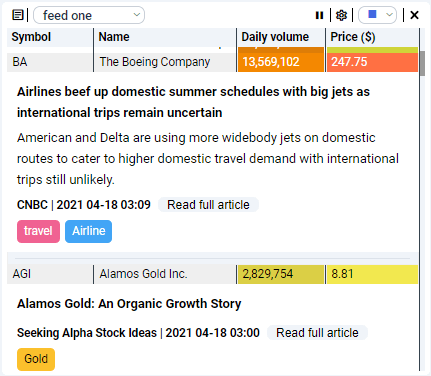
The newsfeed tile displays published news from all major stock market sources and is updated in real-time. Attached to the news are customizable keywords and data columns of the stocks related to the article. Filters and the displayed columns are fully customizable.
Watchlist
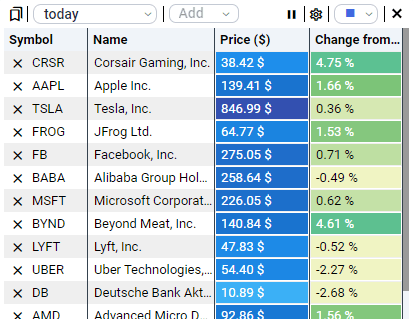
The watchlist tile enables you to manage important stocks for your trading strategy. You can configure the data columns you want to see and sort the toplist by column.

Toplist
In the toplist tile you can view a current toplist for a defined filter, for example, price. To customize your selected toplist even more, it is possible to add other filters. Just as with the alert tile, you can define which columns you want to see. For each column with a value, you can also define a custom color scheme.
News and Clock
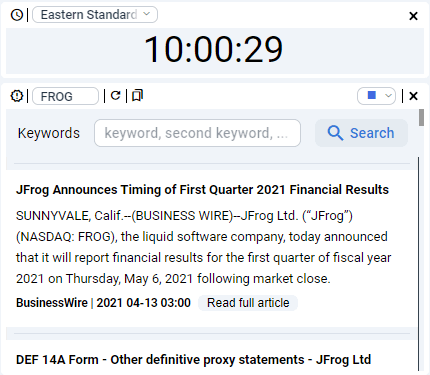
With the clock tile, you can see the current time in a choosen timezone. The stock news tile provides the latests news for a choosen symbol. Futhermore, it is possible to filter the articles by one or multiples keywords.
Data
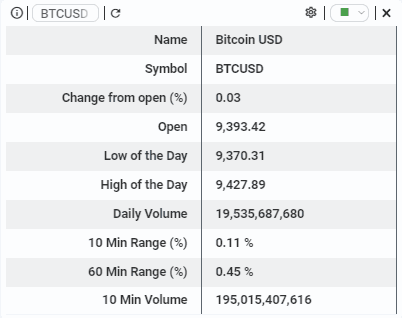
The data tile gives you all the important data about a stock or currency. It shows the current market data at the moment when it is loaded. You can also configure swhich data you want to view in a tile.
Plenty of supported configurations
ChartsWatcher offers a wide range of different filters and alerts to configure complex strategies. Multiple filters can be applied to an alert or toplist configuration.
| Alert Configs | ||
|---|---|---|
| High/Low of the day | (2,5,15,30 min) | |
| New candle high | (1,2,5,15,30,60 min, 4h, 1 Day) | |
| New candle low | (1,2,5,15,30,60 min, 4h, 1 Day) | |
| VWAP acts as support | ||
| VWAP acts as resistance | ||
| Volume spike | (1,2,5,15 min) | |
| Upper shadow | (1,2,5,15 min) | |
| Reject last low | (1,2,5,15 min) | |
| Reject last high | (1,2,5,15 min) | |
| Opening range breakout | (1,2,5,15,40,60 min) | |
| Opening range breakdown | (1,2,5,15,40,60 min) | |
| Near last low | (1,2,5,15 min) | |
| Lower shadow | (1,2,5,15,30,60 min, 4h, 1 Day) | |
| Halt/Resume | ||
| Doji Candle | (1,2,5,15,30,60 min, 4h, 1 Day) | |
| Crossing above | (Open, Close, VMAP) | |
| Crossing below | (Open, Close, VMAP) | |
| Break under recent low | (1,2,5,15,30,60 min, 4h, 1 Day) | |
| Break under recent high | (1,2,5,15,30,60 min, 4h, 1 Day) | |
| Bearish haram candle | (1,2,5,15 min) | |
| Bearish engulfing candle | (1,2,5,15 min) | |
| Bearish candle close | (1,2,5,15 min) | |
| Bullish candle close | (1,2,5,15 min) | |
| Near low/high of the day | ||
| ... more coming soon | ||
| Filter Configs for Alerts and Toplists | ||
|---|---|---|
| Change $ | (2,5,15,30 min) | |
| Relative Volume % | (1,2,5,15,30 min, Daily) | |
| Percentage Range % | (1,2,5,15,30 min, 5, 10, 20 day) | |
| Position in Range % | ||
| RSI(14) | ||
| Change from SMA | (1,2,5,15 min) | |
| Change from open / close | (1,2,5,15,30,60 min, 4h, 1 Day) | |
| Change from EMA | (1,2,5,15 min) | |
| Average volume | (1,2,5,15 min) | |
| Absolute Volume $ | (1,2,5,15 min) | |
| Range $ | (1,2,5,15,30,60 min, 4h, 1 Day) | |
| Time | (1,2,5,15,40,60 min) | |
| Price | (1,2,5,15,40,60 min) | |
| Float | (1,2,5,15,30,60 min, 4h, 1 Day) | |
| ... more coming soon | ||
Our Pricing Plan.
To make ChartsWatcher affordable for everyone we provide different pricing plans including a free plan. All plans are available as monthly and yearly subscriptions. All monthly subscriptions cost $10 dollar more per month than the yearly one.Starter
$19.99/monthplus VAT(varies by country)
- Upto 4 Dashboard Screens
- Upto 15 Screens per screen
- Upto 3 Watchlists configs
- Upto 10 Alert configs
- Upto 2 Newsfeed configs
- Upto 10 Color configs
- Upto 50 table rows visible
- No Time limits
- Dark theme
- Export/Import configs
- Backtesting
Standard
$39.99/monthplus VAT(varies by country)
- Upto 4 Dashboard Screens
- Upto 15 Screens per screen
- Upto 3 Watchlists configs
- Upto 10 Alert configs
- Upto 2 Newsfeed configs
- Upto 10 Color configs
- Upto 50 table rows visible
- No Time limits
- Dark theme
- Export/Import configs
- Backtesting
Pro
$79.99/monthplus VAT(varies by country)
- Upto 4 Dashboard Screens
- Upto 15 Screens per screen
- Upto 3 Watchlists configs
- Upto 10 Alert configs
- Upto 2 Newsfeed configs
- Upto 10 Color configs
- Upto 50 table rows visible
- No Time limits
- Dark theme
- Export/Import configs
- Backtesting